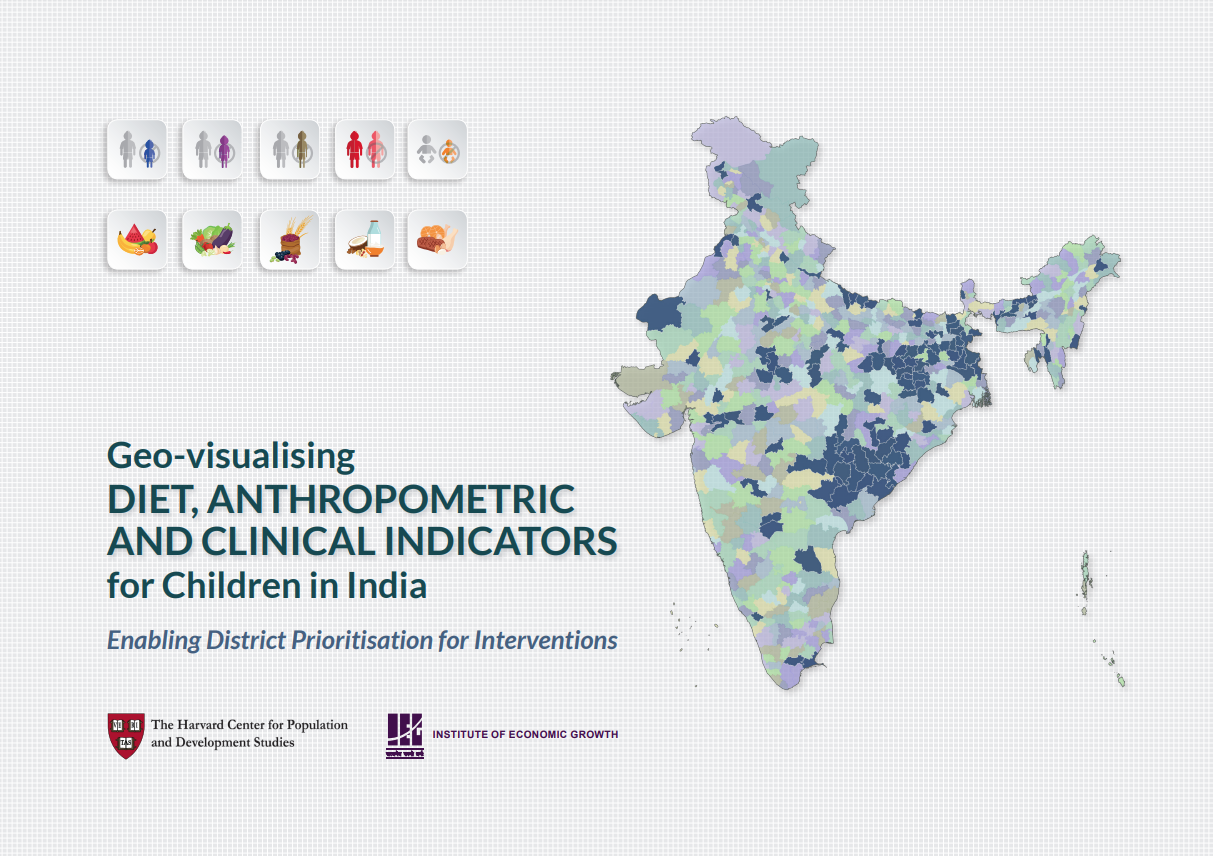
Geo-visualizing Diet, Anthropometric and Clinical Indicators for Children in India

The nutritional status of children in India fares much worse in global comparisons. Using the disaggregated data from the fourth National Family Health Survey (NFHS 2015-16), we present a dashboard and atlas for 31 nutritional indicators that include diet, anthropometry, clinical and service utilization measures of child nutrition for the districts of India. The geo-visualizations are presented with a motivation to help various stakeholders prioritise indicators and districts for interventions. 

Notwithstanding the value of utilising the summary data for select indicators made available by the fifth NFHS (2019-20) for 17 states and 5 Union Territories, it is important to note that a truly all-India picture covering all districts of India will not be available at least until the later part of 2021. Even as we await the availability of disaggregated data for a full range of indicators, there remains much to be investigated and learned from a more detailed examination of the fourth round of the NFHS.

Visualization

Authors: Akhil Kumar, Weixing Zhang, S V Subramanian. Dashboard on Geo-visualising Diet, Anthropometric and Clinical Indicators for Children in India. December 2020, Cambridge MA, Harvard Center for Population and Development Studies.

NOTE: The legend and rank show the Prevalence-Headcount Metric (PHM) which was calculated by adding the normalized values of prevalence and headcount together. Blank areas with unavailable data.

Atlas Image

Subramanian S V, Sarwal Rakesh, Joe William, Kim Rockli, 2022, "Geo-visualising Diet, Anthroprometric and Clinical Indicators for Children in India", https://doi.org/10.7910/DVN/ZSH8HR (Corrigendum)


Methodology & Indicators

PHM Methodology

We estimated the burden for each of the nutritional deprivation indicators along two dimensions of Prevalence (P) and Headcount (H), and combined them to derive a Prevalence-Headcount Metric (PHM).

Prevalence

The metric P was calculated as children with nutritional deprivation (q) divided by the eligible sample of children (n) in the district (j) and expressed in percentage as:

Pj = (qj / nj) × 100

The P metric quantifies the risk of a child experiencing nutritional deprivation in a district. For example, in the Kupwara district of Jammu and Kashmir, 137 (q) out of 435 (n) sample of eligible children were stunted, translating into a district prevalence of 31.5%; in other words, one out of every three children is at risk of being stunted. Thus, the P metric helps identify districts where the future risk of a specific nutritional deprivation should be reduced.

However, the P metric does not contain any information on the absolute number of children who are at risk because it does not take into account the total population of children in a district. For example, consider the districts of Hyderabad (16.7%) and South Garo Hills (16.6%); both have the same P metric but differ with regards to the under-five population of 398,513 and 23,953, respectively, translating to different levels of absolute burden.

Headcount

The metric H is given as the product of P and the total eligible population N for each district.

Hj = Pj × Nj

Returning to the above example, the number (H) of stunted children is substantially large in Hyderabad (66,553) than South Garo Hills (3,970) despite both districts having the same prevalence because the total population burden by nutrition deprivation in Hyderabad is substantially larger.

Prevalence-Headcount Metric

We developed a combined Prevalence-Headcount metric (PHM) that takes into account the features of both the risk (P) as well as the headcount (H) to provide a comprehensive picture of the burden of nutritional deprivation in a district. We computed the PHM using the following steps. We exemplify these steps using the district of Kupwara, Jammu and Kashmir for the nutritional deprivation indicator of stunting.

P = Prevalence; H = Headcount;

PHM = Prevalence-headcount metric;

j = District;

q = Number of children with nutritional deprivation within the eligible sample;

n = Eligible sample; N = Eligible population;

norm = Normalized; max = district with the Maximum value;

min = district with the Minimum value;

STEP 1: Calculating Prevalence

Formula: Pj = (qj / nj) x 100

Examples: qj = 137

                    nj = 435

                    Pj = (137 / 435) x 100 = 32%

STEP 2: Calculating Headcount

Formula: Hj = Pj x Nj

Examples: Pj = 32%

                     Nj = 166791

                     Hj = (32 / 100) x 166791 = 53373

STEP 3: Normalizing the Prevalence

Formula: Pjnorm = (Pj - P(min)) / (P(max) - P(min))

Examples: Pj = 32%

                     P(max) = 65%

                     P(min) = 13%

                     Pjnorm = (32 - 13) / (65 - 13) = 0.365

STEP 4: Normalizing the Headcount

Formula: Hjnorm = (Hj - H(min)) / (H(max) - H(min))

Examples: Hj = 53373

                     H(max) = 460209

                     H(min) = 346

                     Hjnorm = (53373 - 346) / (460209 - 346) = 0.115

STEP 5: Calculating the PHM

Formula: PHMj = (Pjnorm + Hjnorm)/2

Examples: Pjnorm = 0.365

                     Hjnorm = 0.115

                     PHMj = (0.365 + 0.115) / 2 = 0.24


Types of Nutritional Deficit

Indicator

Age Group

Definition

Diet and Anthroprometric Failure

6-23 months

Children with both dietary as well as anthropometric failures

Diet Failure Only

6-23 months

Children with at least one or more dietary failures but no anthropometric failure

Anthropometric Failure Only

6-23 months

Children with at least one or more anthropometric failures but no dietary failure

Dietary Measures

Indicator

Age Group

Definition

Inadequate Diet

6-23 months

Children who did not receive minimum acceptable diet

Inadequate Diet Diversity

6-23 months

Children who did not receive minimum dietary diversity

No Solid/Semi-Solid Food

6-23 months

Children who did not consume solid or semi solid food in the day or night preceding the interview

No Dairy

6-23 months

Children who did not consume milk and milk products in the day or night preceding the interview

No Nuts/Legumes

6-23 months

Children who did not consume nuts and legumes in the day or night preceding the interview

No Grains/Roots/Tubers

6-23 months

Children who did not consume grains in the day or night preceding the interview

No Eggs

6-23 months

Children who did not consume eggs in the day or night preceding the interview

No Flesh Foods

6-23 months

Children who did not consume fish, chicken, meat in the day or night preceding the interview

No Vit-A Rich Fruits/Vegetables

6-23 months

Children who did not consume Vit-A rich fruits and vegetables in the day or night preceding the interview

No Other Fruits/Vegetables

6-23 months

Children who did not consume other fruits and Vegetables in the day or night preceding the interview

Anthropometric/Clinical Measures

Indicator

Age Group

Definition

Stunting or Underweight or Wasting

0-59 months

Children who are either stunted, wasted or underweight

Stunting & Underweight & Wasting

0-59 months

Children who are stunted, underweight and wasted

Stunting & Underweight

0-59 months

Children who are stunted and underweight but not wasted

Underweight & Wasting

0-59 months

Children who are underweight and wasted but not stunted

Stunting

0-59 months

Children who are stunted (short height-to-age)

Severe Stunting

0-59 months

Children who are severly stunted (short height-to-age)

Underweight

0-59 months

Children who are underweight (low weight-to-age)

Severe Underweight

0-59 months

Children who are severely underweight (low weight-to-age)

Wasting

0-59 months

Children who are wasted (low weight-to-height)

Severe Wasting

0-59 months

Children who are severely wasted (low weight-to-height)

Anemia

6-59 months

Children with hemoglobin level less than 11.0 g/dL

Severe Anemia

6-59 months

Children with hemoglobin level less than 7.0 g/dL

Low Birth Weight

0-59 months

Children with written record of birthweight less than 2.5 kg

Breastfeeding Practices

Indicator

Age Group

Definition

No Early Breastfeeding

0-12 months

Children who were not breastfed within 1 hour of birth

No Exclusive Breastfeeding

0-12 months

Children who were not exclusively breastfed

Service Utilization

Indicator

Age Group

Definition

No Hot Cooked Meal

> 36 months

Children who did not receive supplemnetary nutrition under ICDS

No Take Home Ration

6-36 months

Children who did not receive supplemnetary nutrition under ICDS

No Vit-A Supplementation

6-59 months

Children who did not receive Vit-A dose in the six months preceding the survey

Publications

Beckerman-Hsu JP, Chatterjee P, Kim R, Sharma S, Subramanian SV. A typology of dietary and anthropometric measures of nutritional need among children across districts and parliamentary constituencies in India, 2016. Journal of Global Health. 2020;10 (2).Abstract

Anthropometry is the most commonly used approach for assessing
nutritional need among children. Anthropometry alone, however, cannot
differentiate between the two immediate causes of undernutrition:
inadequate diet vs disease. We present a typology of nutritional need by
simultaneously considering dietary and anthropometric measures, dietary
and anthropometric failures (DAF), and assess its distribution among children
in India. We used the 2015-16 National Family Health Survey, a nationally
representative sample of children aged 6-23 months (n = 67 247), from
India. Dietary failure was operationalized using World Health Organization
(WHO) standards for minimum dietary diversity. Anthropometric failure was
operationalized using WHO child growth reference standard z-score of <-2
for height-for-age (stunting), weight-for-age (underweight) and weight-forheight
(wasting). We also created a combined anthropometric measure for
children who had any one of these three anthropometric failures. We crosstabulated
dietary and anthropometric failures to produce four combinations:
Dietary Failure Only (DFO), Anthropometric Failure Only (AFO), Both Failures
(BF), and Neither Failure (NF). We estimated the prevalence and distribution
of the four types, nationally, and across 640 administrative districts and 543
Parliamentary Constituencies (PCs) in India. Nationally, 80.3% of children
had dietary failure and 53.7% had at least one anthropometric failure. The
prevalence for the four DAF types was: 44.0% (BF), 36.3% (DFO), 9.8% (AFO),
and 9.9% (NF). Dietary and anthropometric measures were discordant for
46.1% of children; these children had nutritional needs identified by only one
of the two measures. Nationally, this translates to 12 181 627 children with
DFO and 3 281 913 children with AFO; the nutritional needs of these children
would not be captured if using only dietary or anthropometric assessment.
Substantial variation was observed across districts and PCs for all DAF types.
The interquartile ranges for districts were largest for BF (29.8%-53.0%) and
lowest for AFO (5.5%-13.4%). The current emphasis on anthropometry for
measuring nutritional need should be complemented with diet- and foodbased
measures. By differentiating inadequate food intake from other causes
of undernutrition, the DAF typology brings precision in identifying nutritional
needs among children. These insights may improve the development and
targeting of nutrition interventions.

Subramanyam MA, Kawachi I, Berkman LF, Subramanian SV. Is economic growth associated with reduction in child undernutrition in India?. PLoS Med. 2011;8 (3) :e1000424.Abstract

Economic growth is widely perceived as a major policy instrument in reducing
childhood undernutrition in India. We assessed the association between
changes in state per capita income and the risk of undernutrition among
children in India. Data for this analysis came from three cross-sectional waves
of the National Family Health Survey (NFHS) conducted in 1992–93, 1998–
99, and 2005–06 in India. The sample sizes in the three waves were 33,816,
30,383, and 28,876 children, respectively. After excluding observations
missing on the child anthropometric measures and the independent variables
included in the study, the analytic sample size was 28,066, 26,121, and 23,139,
respectively, with a pooled sample size of 77,326 children. The proportion
of missing data was 12%–20%. The outcomes were underweight, stunting,
and wasting, defined as more than two standard deviations below the World
Health Organization–determined median scores by age and gender. We also
examined severe underweight, severe stunting, and severe wasting. The main
exposure of interest was per capita income at the state level at each survey
period measured as per capita net state domestic product measured in 2008
prices. We estimated fixed and random effects logistic models that accounted
for the clustering of the data. In models that did not account for survey-period
effects, there appeared to be an inverse association between state economic
growth and risk of undernutrition among children. However, in models
accounting for data structure related to repeated cross-sectional design
through survey period effects, state economic growth was not associated
with the risk of underweight (OR 1.01, 95% CI 0.98, 1.04), stunting (OR 1.02,
95% CI 0.99, 1.05), and wasting (OR 0.99, 95% CI 0.96, 1.02). Adjustment for
demographic and socioeconomic covariates did not alter these estimates.
Similar patterns were observed for severe undernutrition outcomes. We
failed to find consistent evidence that economic growth leads to reduction
in childhood undernutrition in India. Direct investments in appropriate health
interventions may be necessary to reduce childhood undernutrition in India.

Rodgers J, Kim R, SV S. Explaining Within-vs Between-Population Variation in Child Anthropometry and Hemoglobin Measures in India: A Multilevel Analysis of the National Family Health Survey 2015–2016. Journal of Epidemiology. 2019 :JE20190064.Abstract

The complex etiology of child growth failure and anemia—commonly used
indicators of child undernutrition—involving proximate and distal risk factors
at multiple levels is generally recognized. However, their independent and
joint effects are often assessed with no clear conceptualization of inferential
targets.We utilized hierarchical linear modeling and a nationally representative
sample of 139,116 children aged 6–59 months from India (2015–2016) to
estimate the extent to which a comprehensive set of 27 covariates explained
the within- and between-population variation in height-for-age, weightfor-
age, weight-for-height, and hemoglobin level.Most of the variation in
child anthropometry and hemoglobin measures was attributable to withinpopulation
differences (80–85%), whereas between-population differences
(including communities, districts, and states) accounted for only 15–20%.
The proximate and distal covariates explained 0.2–7.5% of within-population
variation and 2.1–34.0% of between-population variation, depending on
the indicator of interest. Substantial heterogeneity was observed in the
magnitude of within-population variation, and the fraction explained, in
child anthropometry and hemoglobin measures across the 36 states/union
territories of India.Policies and interventions aimed at reducing betweenpopulation
inequalities in child undernutrition may require a different set of
components than those concerned with within-population inequalities. Both
are needed to promote the health of the general population, as well as that
of high-risk children.

More Publications